Interactive data for Ajman attractiveness index (Community satisfaction)

Ajman Statistics Center offers a number of tools to display information in an interactive manner, allowing the user to explore the data of Ajman Emirate in a way that suits his different needs, such as interactive maps, dashboards, applications for mobile devices, and others.
Community satisfaction studies were carried out in Ajman Emirate according to the vision of the Emirate of Ajman: a happy society that contributes to building a green economy, stimulated by a distinct government consistent with the spirit of the union.
According to the axis of "a better place to live", which serves the sectoral objective "improving infrastructure and public services".
According to the axis of "a vibrant society", which serves the objectives of "improving lifestyle and health care" and "raising the level of education and promoting culture."
Six studies were approved to measure satisfaction with Services of Telecommunication, Health care, Education, Infrastructure, Public services, Public transportation.
.
Interactive maps
-
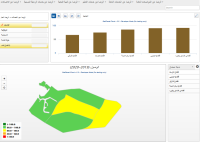
Satisfaction by geographic sectors
More details...These tools display the statistical indicators of community satisfaction studies in Ajman Emirate in an interactive manner in the form of graphs and thematic maps (categorized according to the focus of the study) that can be customized to suit the different needs of the user at the level of the different geographical sectors of Ajman Emirate.
You can choose the year from the bottom of the map, knowing that the sectors (Eastern, Northern, Al-Zora) are less than 30 surveys for the year 2018-2019
-
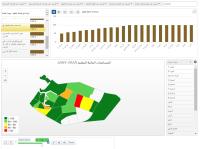
Satisfaction by districts
These tools display the statistical indicators of community satisfaction studies in Ajman Emirate in an interactive manner in the form of graphs and thematic maps (categorized according to the focus of the study) that can be customized to suit the different needs of the user at the level of the different geographical districts of Ajman Emirate.More details...
Help Tools
DASHBOARDS
-
Ajman attractiveness index
These tools display statistical indicators for the study of satisfaction with different sectors (Telecommunication, Health care, Education, Infrastructure, Public services, Public transportation) in an interactive manner on the indicator panels with the availability of filters for choices.More details... -
Study of social indicators
These tools display statistical indicators for social indicators study on cultural activities and impression of the residential area interactively on indicator panels with filters for selections. In addition to study of participation and influence on local decisionsMore details... -
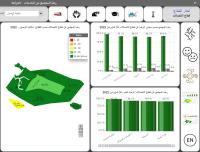
Visual analysis
These tools display indicators of community satisfaction studies for the year 2019-2020 in an interactive way to help visual analysis of the results.More details...
Help Tools
Interactive reports
-
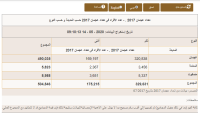
Interactive reports
These tools allow you to design the required reports from the data of community satisfaction studies in an interactive manner, according to your needs from the columns available to design the table.More details...


